

Skip to content
Chat with your data · How-to

See your canvas as a dashboard, chat in full view and save it as a PDF

A free-form canvas is great for exploring. When you want to read the results or hand them on, a dashboard is easier. Your workspace now gives you both, with the AI chat a click away and a PDF of the whole thing.

For the complete AI-readable content index, see /llms.txt.

By AnuragUpdated 5 min read
Share
On this page
  1. Why a dashboard view
  2. Switch between Dashboard and Canvas
  3. How the dashboard arranges your tiles
  4. Ask a question, see it on the dashboard
  5. Full view and the AI chat
  6. Save or share the dashboard as a PDF
  7. FAQ

Key takeaways

  • Every canvas opens as a dashboard. Switch to Canvas when you want to arrange things freely.
  • New answers appear under Your questions, and Show in the chat takes you straight to the tile.
  • Full view gives the dashboard your whole screen, and AI chat brings the assistant back as a side panel.
  • Export saves the whole dashboard as a PDF, with pages that break between rows of tiles.

Why a dashboard view

On a canvas you can put charts anywhere, which is handy while you are still exploring. But a board with charts scattered across it is hard to read at a glance, and harder to share with someone who wasn't there when you built it.

The dashboard view lays the same charts out in tidy rows, with your headline figures at the top. Nothing is copied or lost. The dashboard and the canvas are two ways of looking at the same work.
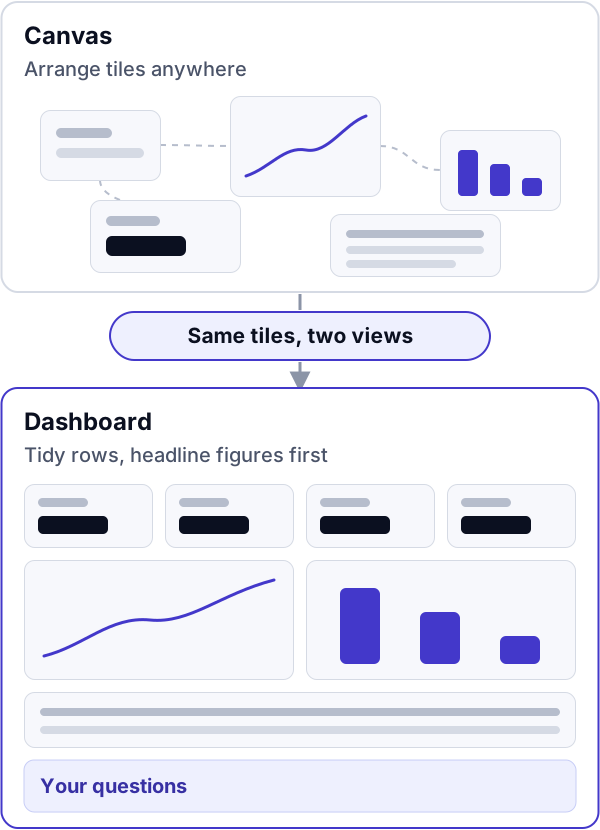
The same tiles shown two ways: scattered freely on a canvas, and laid out as a dashboard with headline figures first, two charts in a row, a full-width table and Your questions below.
One set of tiles, two views. The canvas is for exploring, the dashboard for reading and sharing.

Switch between Dashboard and Canvas

  • Dashboard is the default. Open a canvas and it shows as a dashboard.
  • Prefer the canvas? Use the Dashboard | Canvas switch at the top. On a computer, your browser remembers the choice and opens the canvas next time.
  • On a phone or other small screen, you always get the dashboard, because it fits the screen.
  • Saved from the playground? A canvas you save from the playground opens straight on its dashboard.

How the dashboard arranges your tiles

You don't lay the dashboard out by hand. It arranges each tile by what it is:

  • Headline figures come first, in a short strip that shares one row. Each shows its change in green or red, and a small trend line when there is one.
  • Charts take half a row each.
  • Tables take the full width.

Everything else follows in the order it sits on the canvas, top to bottom and left to right, and every row is filled edge to edge. To change the order, move tiles on the canvas. Each tile keeps its menu, so you can change a chart, explain it or remove it from the dashboard. Removing a tile offers Undo.

Ask a question, see it on the dashboard

Ask the assistant a question and the answer is added under Your questions, below the rest of the dashboard. It scrolls into view and is outlined for a moment, so you can see what changed. Click a tile first to make it the subject of your next question, for example to break it down further.

In the chat, choose Show on an earlier answer to jump to its tile. New to asking questions of your data? Start with Chat with your data: the complete guide.

Full view and the AI chat

On a wide screen, choose Full view above the dashboard. The menu and the assistant are put away, and the dashboard takes the whole width. It is a good way to present your results in a meeting.

  • AI chat at the bottom right brings the assistant back as a panel over the right edge, with your whole conversation.
  • An answer keeps coming while you close and open the panel, so you never lose it.
  • Escape closes the chat first, then leaves full view. Or choose Exit full view.
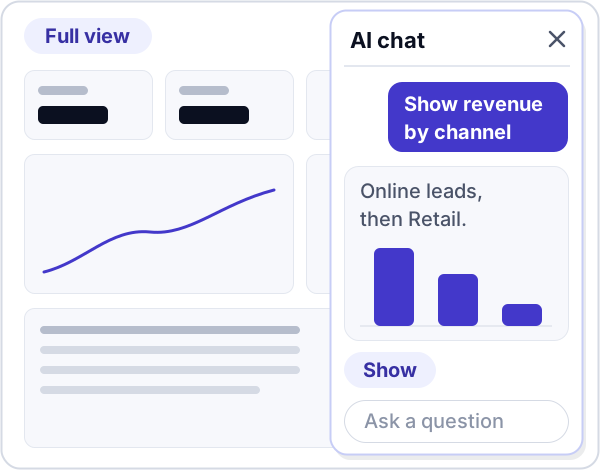
A dashboard in full view with the AI chat panel open over its right edge, showing a question about revenue by channel, a chart answer and a Show button.
Full view with the AI chat open. Show takes you to the answer's tile on the dashboard.

Save or share the dashboard as a PDF

The Export menu above the dashboard has everything you need to hand your work on:

  • Save as PDF downloads the whole dashboard, not just the part on your screen.
  • Share as PDF opens your device's share options, or downloads the file where sharing isn't available.
  • Email me this dashboard sends it to your inbox, and Scheduled reports sets up regular emails for your team.
  • Review calculations runs the check described below whenever you like.

Before a PDF is made, DashboardGPT checks every chart. If one has something its picture doesn't show, the review opens first and you choose when to carry on. The PDF continues over as many A4 pages as it needs, and pages break between rows of tiles, so charts stay in one piece. A wide dashboard prints across the page and a narrower one down it. Every page is numbered, and the chart details follow at the end.
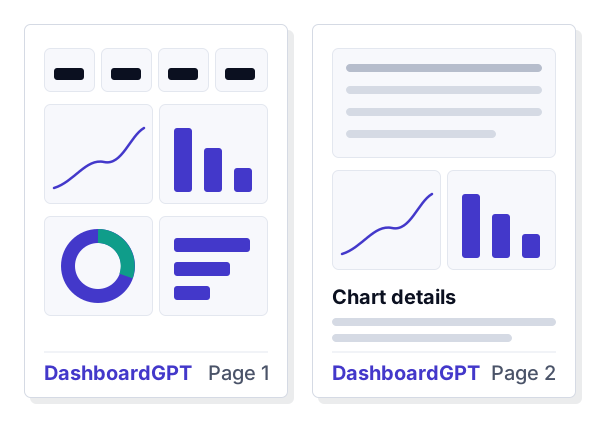
A dashboard saved as two numbered A4 pages. The first page breaks after a full row of tiles, and the second ends with the chart details.
Pages break between rows of tiles, so no chart is cut in half.

Want the dashboard in your team's inbox every week? See scheduled email reports. To try all of this on your own numbers, upload a file to the playground, sign up for a free workspace or compare plans on the pricing page.

Frequently asked questions

No. They are two views of the same tiles. A tile you remove or change in one is the same in the other.

Not by dragging. The dashboard arranges tiles for you, with headline figures first. To change the order, move tiles on the canvas, and the dashboard follows it from top to bottom.

The dashboard. On phones and other small screens the dashboard is always shown, because it fits the screen.

Full view is for wide screens. On a smaller screen the dashboard already takes the full width.

The whole dashboard on numbered A4 pages, with breaks between rows of tiles, followed by the details of how each chart was calculated.

Not yet. Scheduled reports, and a PDF saved from the canvas view, keep the canvas layout.
Share this guide

More in Chat with your data

Keep reading

Pillar guide

Chat with your data: the complete guide to AI data analysis

How natural-language analytics works, where it beats pivot tables and SQL, and how to phrase questions so the answer is a chart you can trust.

Start here
How-to

From sign-up to your first dashboard in about three minutes

Sign up, add a file and get a canvas and your first answer in about three minutes.

How-to · 4 min read
How-to

How to chat with a CSV file and get charts, not paragraphs

Upload, ask, follow up: a walkthrough with a 40,000-row orders file.

How-to · 5 min read
How-to

How to chat with a Google Sheet and keep the answers up to date

Import a worksheet, ask it questions and keep the answers up to date.

How-to · 5 min read
How-to

How to ask questions of your Google Analytics and Search Console data

Ask your website traffic and search performance questions, and get charts back.

How-to · 6 min read
How-to

Ask about one dataset, starting from questions built for it

Start from questions built for each file, sheet or report, answered from that data.

How-to · 5 min read
How-to

Turn a spreadsheet into a canvas of charts in one step

Import a file or sheet and get a canvas of charts built for it in one step.

How-to · 5 min read
How-to

Send your dashboard by email on a schedule, with an AI summary

Email a canvas to your team on a schedule, with an AI summary and a PDF.

How-to · 5 min read
How-to

Get answers about DashboardGPT in seconds with the docs and Ask AI

Find answers in the docs, or ask the Ask AI box and get links to the guides behind each answer.

How-to · 4 min read
Explainer

AI answers that pick the right data and try again when they slip

How the assistant picks the right file, focuses on the right columns and tries again when it slips.

Explainer · 4 min read
How-to

Chat with your database: connect PostgreSQL, MySQL or MongoDB

Connect PostgreSQL, MySQL or MongoDB, choose what is shared and ask questions in plain English.

How-to · 5 min read
Explainer

Natural language to chart: how AI turns a question into a visual

What happens between your question and the chart, step by step.

Explainer · 5 min read
Test kit

How to test an AI data analyst: 50 questions and the ways answers go wrong

A 50-question test kit and the eight ways AI answers usually go wrong.

Test kit · 5 min read

Other topic hubs

Newsletter

New guides, in your inbox

A weekly digest of new guides and what shipped. No sales emails, and you can unsubscribe any time.

We only use your address for the newsletter. See our Privacy Policy.

Ask your data a question.

Open the playground and ask about revenue, churn or campaign spend. Charts, metrics and written insights appear on an infinite canvas.

  • No account, no install
  • Free plan with CSV and Excel uploads
  • Bring your own AI key