

On this page
Key takeaways
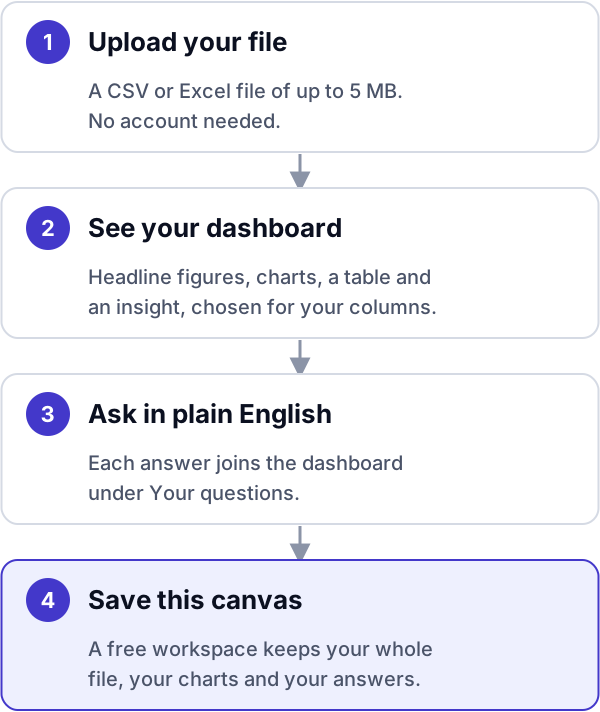
- Upload one CSV or Excel file of up to 5 MB in the playground. You don't need an account.
- Your file opens as a dashboard built from its own columns, before you ask a single question.
- Save this canvas brings your whole file, your charts and your answers into a free workspace.
- A file you don't save is deleted after 24 hours, and it is never used to train AI models.
Why try it on your own data
Most analytics tools ask you to sign up before you see anything useful. Then you spend the first hour on setup, and you still don't know whether the tool understands your numbers.
The DashboardGPT playground works the other way round. Bring a file you already have, such as an export of orders, sign-ups or sales. In a few seconds you see a dashboard of it, and you can ask it questions in plain English. You only create an account if you want to keep what you built.
Comparing a few tools? Our guide to the best conversational BI tools explains what to test on each one.
Upload your file in four steps
- Open the playground and choose Try your own data at the top.
- Drop in a CSV, XLS or XLSX file of up to 5 MB, or choose one from your computer.
- Watch the progress: DashboardGPT checks the file, reads the rows, looks at each column and builds your dashboard.
- The dialog closes by itself, and your file appears in the picker above the chat, under Your file.
The playground reads the first 5,000 rows. If your file is longer, it tells you how many rows it kept out of how many. A free workspace keeps them all.
What your dashboard shows
You don't have to think of a first question. The dashboard is chosen to suit your columns:
- Headline figures. Up to four totals at the top. When your file has dates, each one shows the change on the previous period and a small trend line.
- Charts. A trend over time, a breakdown by your most useful category, and a share or ranking where it fits.
- A table and a written insight. Your main figures by category, and a short note on what stands out.
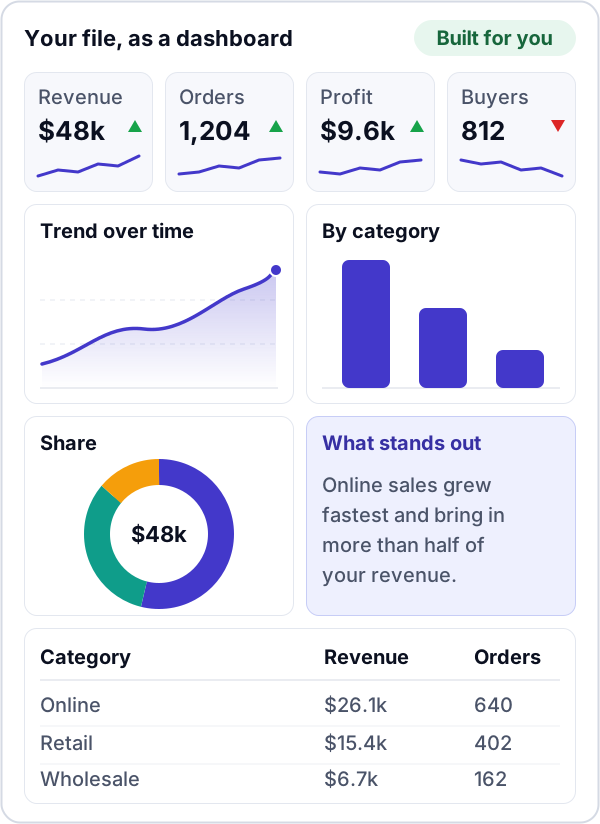
Building the dashboard does not use any of your free questions. Want to arrange things your own way? On a computer, use the Dashboard | Canvas switch to open the same charts on a free-form canvas. Full view gives the dashboard the whole screen, and AI chat brings the conversation back when you need it.
Ask questions about it
Type a question in the chat, or start from the suggestions made for your file. Each answer is added to the dashboard under Your questions, scrolled into view so you don't miss it. You can change a chart's type, show the numbers behind it or remove it.
Save it to a free workspace
After your third answer, Save this canvas opens. You can close it with Keep exploring, and the same button stays in the header from the moment your file is ready. When you want to keep your work:
- Choose Save this canvas.
- Sign up with Google, Microsoft 365 or email. No card is needed.
- Your new workspace opens and sets itself up. It copies your whole file, not just the first 5,000 rows, and rebuilds your charts and answers on all of it.
Your workspace also gets bonus AI runs, and every new account starts on a free 15-day trial of the Team plan. See what the free Team trial includes.
Your file stays private
- Only you can see it. Your file is visible only in your own playground visit.
- It is never used to train AI models.
- It doesn't stay around. A file you don't save is deleted after 24 hours. Choose Remove my file to delete it sooner.
Ready to see your own numbers? Open the playground and upload a file, or sign up and start with a free workspace. To compare plans, see the pricing page.